The most common metric among inventory management specialists is forecast accuracy. In almost any case study, presentation, or video dedicated to improving inventory planning efficiency, you will likely encounter phrases like "managed to increase forecast accuracy from 60% to 80%."
But what does this forecast accuracy mean for the company as a whole? It is usually calculated through forecast error. For example, if the forecast's Mean Absolute Percentage Error (MAPE) is 20%, then the forecast accuracy is 80%.
But is this good or bad for the business? And how did increasing the MAPE accuracy by 20% affect profit? These questions typically remain outside the scope of discussions.
Another point to consider is the methodology used to calculate forecast accuracy. In business publications, this is often not emphasized. Yet, it's one of the most crucial questions, as results can vary significantly.
To illustrate this, let's consider an example. The graph shows the planned forecast and actual sales of buns over several days.
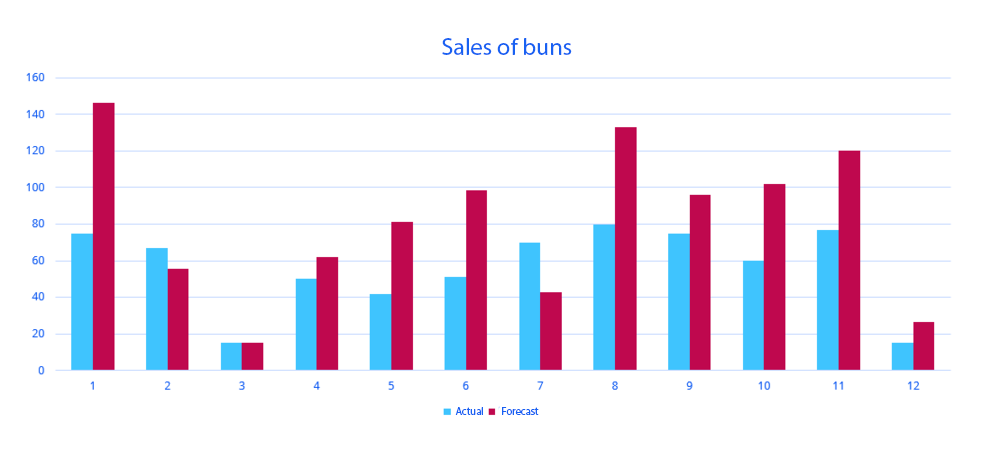
Let's see what the prediction error will be depending on the metric used.
| Forecasting Error | Error Value |
| MAD | 31.610 |
| MSE | 1407 |
| RMSE | 37.5 |
| MAPE | 55% |
| sMAPE1 | 23% |
| sMAPE2 | 42% |
As can be seen from the table, there is a large variance in values. These can be easily manipulated by using and showcasing the metrics that appear more attractive.
A separate question is how to calculate the overall forecast accuracy for the entire company. If the forecast accuracy for one product is 90% and for another is 50%, does that mean the overall accuracy is 70%? Or should we also consider each product's contribution to the total turnover? In units? Or in monetary terms?
Many shortcomings of this indicator can be extensively discussed. We have already delved into these details in the article "Why Increasing Forecast Accuracy Does Not Guarantee Increased Profit: How a Conventional Metric Misleads Companies."
What About the Money?
Now let's consider what truly matters to businesses. Every business is profit-oriented. This means that all the tools used in business should also be aimed at increasing profit. Their effectiveness should be evaluated from this perspective, not just by abstract values.
What does forecast accuracy tell us about money? There's no direct correlation here because real-world trading involves dealing with a multitude of factors. These include:
- Cost of storing goods.
- Delivery timelines.
- Supplier conditions.
- The amount of goods left in stock on the date of the next delivery.
- Cost of transportation and movement.
- Cost of writing off expired and unsellable goods.
- Impact of promotional campaigns and seasonality.
- Profitability of investing money in inventory (is it more profitable to simply put some money in a deposit?).
- And other factors.
The most crucial task in inventory management is to find the balance in the quantity of goods so that the company's costs are minimized and the profit is maximized.
Forecast accuracy alone cannot answer this question.
What should be measured?
A significant advantage of forecast accuracy is the illusion of simplicity, which is why it's so popular in business circles. However, if you're focused on profit, there isn't a single, simple metric. Several criteria need to be assessed comprehensively:
- Inventory Turnover: This shows how many times average stocks are turned over in a year. It is calculated annually or in terms of turnover days.
- Second-Level Service Rate (Fill Rate): This represents the proportion of demand we can reliably cover using existing inventory over the replenishment period. We recommend calculating the service level in monetary terms. For instance, various filters and special equipment sell at different rates and cannot be compared in units.
- Inventory Profitability: This indicates how much money is made for every dollar invested in inventory. A 200% profitability means you invested a dollar and earned two, and 150% means earning one and a half dollars for every dollar invested.
- Missed Profit: This shows how much money the company missed out on due to shortages.
- Inventory Structure: It shows the total volume of inventory, the proportion of non-liquid assets, and excesses.
The key to all of this is a comprehensive assessment of all indicators. If you choose just one, as with forecast accuracy, it may lead you astray. For instance, a low turnover of one product could be a result of excess inventory, while a high turnover might be due to frequent periods of shortage. This single indicator, isolated from others, will give an entirely misleading picture of inventory management efficiency.
A combination of these indicators over time provides an understanding of how effectively the company is operating. They can also be used to assess and compare different inventory management systems. A detailed review of these metrics can be found in the article “Key Performance Indicators for Inventory Management.”
Ultimately, the decision whether to focus on high forecast accuracy or profitability is up to you.