To assess the efficiency of inventory management and make management decisions, it is essential to look at all the indicators collectively: lost profits, service level, inventory turnover, profitability of stocks, etc. We discussed which indicators are crucial in the previous articles, "Key Performance Indicators for Inventory Management Efficiency. Part 1" and "Key Performance Indicators for Inventory Management Efficiency. Part 2".
So, now that we have calculated everything, what should we do next? What methods exist for evaluating the effectiveness of inventory management? How to do it correctly in your company? What figures should you focus on, and who should you compare yourself with?
Calculating KPIs and evaluating the effectiveness of inventory management helps us understand what improvements can be made in this area. We will discuss this in the present article.
Assessing the effectiveness of inventory management. Important criteria
So, what criteria can we use to aggregate data for comparison? Any! It depends on what your task is. If you need analysis by product groups – we aggregate by groups. Want to compare warehouses – we aggregate by warehouses. Need to compare suppliers – please do. Divide the data by suppliers and compare them with each other. Want to compare by ABC-analysis groups and see what we do better – AA or BB, we aggregate by this data.
For example, let’s look at how to compare suppliers by performance indicators. We can understand which supplier gives us the most significant earned profit. In this case, these are the suppliers ProRab and Umelets.
Assessment of inventory management effectiveness. Table: suppliers Foreman and Craftsman.
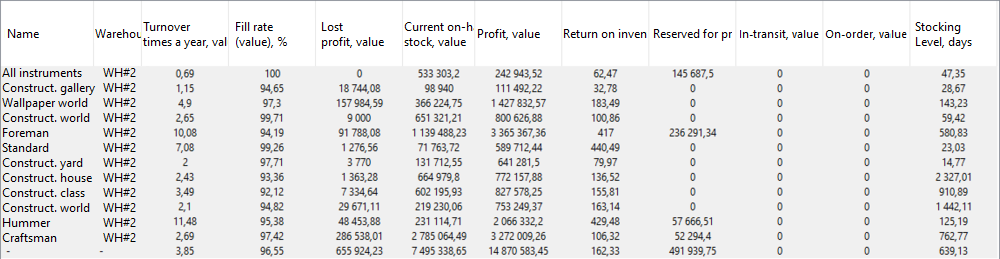
Similarly, we can see which supplier has the highest indicators of stock profitability or lost profit. Suppose we found a supplier with the most significant lost profit. What to do with it? In this case, we need to understand why this happens. Maybe he consistently fails to deliver goods to us. Possibly, he breaks delivery deadlines, and because of this, shortages arise.
Such analysis allows us to take a detailed look at the supplier, understand what the problem is, and make some management decisions. For example, change the supplier or review the terms of work with him. This is work to increase the effectiveness of inventory management.
For example, let’s look at how to aggregate data for ABC analysis. We conduct analysis, add subgroups, and calculate efficiency indicators for them. Look at what is better.
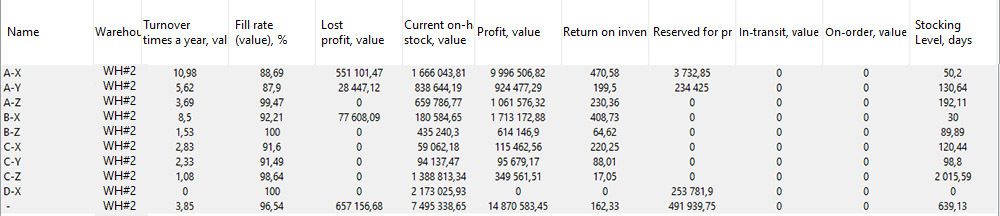
Assessment of inventory management effectiveness. An example of a table on how to aggregate data for ABC analysis.
What do we see in the figure? It is clear that for group AX, which is most often sold, has the highest turnover. At the same time, we see that we do not have the highest service level for this group. Although this group of goods is often and stably sold, we lose money on it. Although it would seem that this group is quite easy to predict, usually there is a risk of overstocking.
At the group level, we can also look for some problematic products and make management decisions for them. We can aggregate data in the way we need. If you have set a task to compare sales points, compare them. Want to see what happens with groups of goods? Please do! But remember: you need to compare only similar groups of goods or sales points with each other.
How to define performance indicators for a distribution center?
When you transport goods to a distribution center, it sells the goods itself, and from there, the goods are distributed to other warehouses and sales points. How should you calculate performance indicators in this case? There are two options:
- Calculate the total for the entire network. Take into account all remaining stocks, and all sales, aggregate and summarize everything.
- Calculate the efficiency of the distribution center. This is the most common practice. Indicators related to sales are taken for the entire network that consumes from it. All indicators related to remaining stocks are taken from the distribution center.
Analysis of inventory management efficiency: subtleties of conducting.
Exclusion of new products when calculating general indicators
If we calculate aggregated indicators for the entire sales point or supplier, we need to exclude new products, because they can spoil the overall statistics. They may have low turnover, etc. If a product is new to the assortment, such data is not credible. For new positions to be excluded from the analysis, there must be criteria that define how many days from the date of sale a product is considered new.
Exclusion of non-warehouse assortment
If we aggregate indicators and we have products that are usually not stored in a warehouse, they will also spoil the statistics, and we will get incorrect data. Assess non-warehouse assortment by two quantities: minimum number of sales and the current period of days. You can set the parameters yourself, how many days of sales a position should have and for what period to be considered a warehouse item. For some groups or stores, it will be more lenient, somewhere stricter.
Do not forget about weekends and the first appearance of the product in the warehouse
This is important when calculating turnover, average sales, and remaining stocks. When we calculate the average remaining stock, it is necessary to do this from the moment the product first appears in the warehouse and not take into account sales on weekends.
Separately assess indicators for stores of different formats
Comparing the efficiency of "Goods at Home" and supermarkets is illogical. They will have fundamentally different profits, lost profits, turnover, and other indicators. It would be more correct to compare all our "Goods at Home" among themselves and do the same with supermarkets.
How should we evaluate the indicators?
Let's say we've measured turnover rates and service levels. But what comes next? What should we compare them to to determine whether we've performed well or poorly? What methods exist for assessing the effectiveness of inventory management? There are two possible approaches:
- Comparing with oneself, i.e., tracking indicators over time. For example, comparing data for two years or two quarters. Alternatively, you could constantly measure indicators and observe the dynamics, such as how our turnover rates change from month to month, etc.
- Benchmarks. This involves comparing our indicators with those that are either standard in the industry, formulated by some expert, or developed by us.
Let's take a closer look at each method.
Evaluating Metrics Over Time
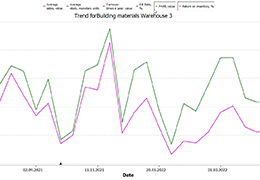
Let's take a look at the graph. The brown line represents turnover, and the blue line represents service level.
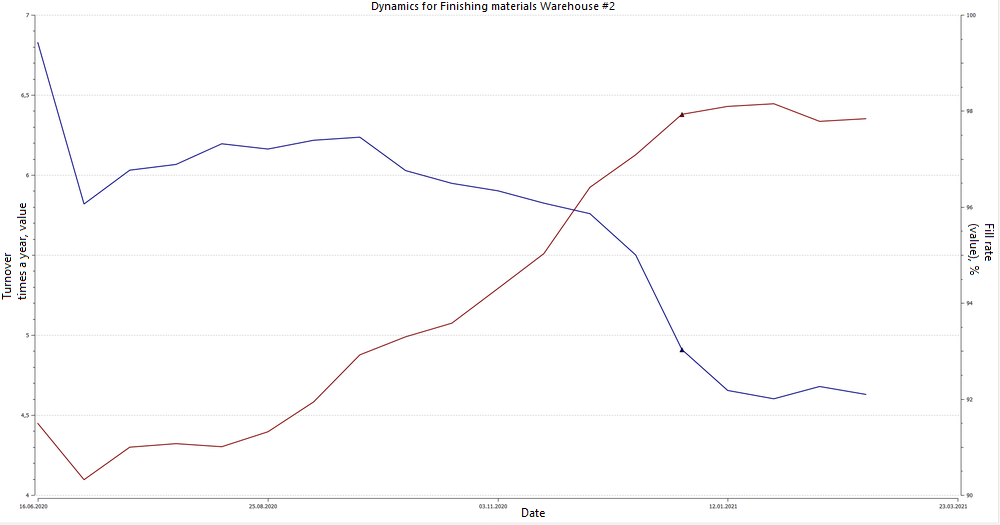
Evaluating metrics over time. Dynamics graph for finishing materials, Warehouse 2. Service level.
The graph shows that while turnover is increasing, the service level is decreasing. If both graphs are going up, that's a good indicator. If both are going down, that's bad. But how do we evaluate this particular situation? Does it signal an increase in the effectiveness of inventory management? It seems that we're bringing in more stock, but turnover is decreasing. This could mean we're not bringing in the right stock because the service level is also going down. This indicates that we have a shortage of popular goods in our warehouses, resulting in both a drop in service level and lost demand.
It is impossible to draw any clear conclusion from this dynamic. A more detailed analysis of the effectiveness of inventory management is required. We need to look at all the indicators separately, including profit and return on inventory. Let's overlay the profit and return graphs for this group of goods. What will we see?
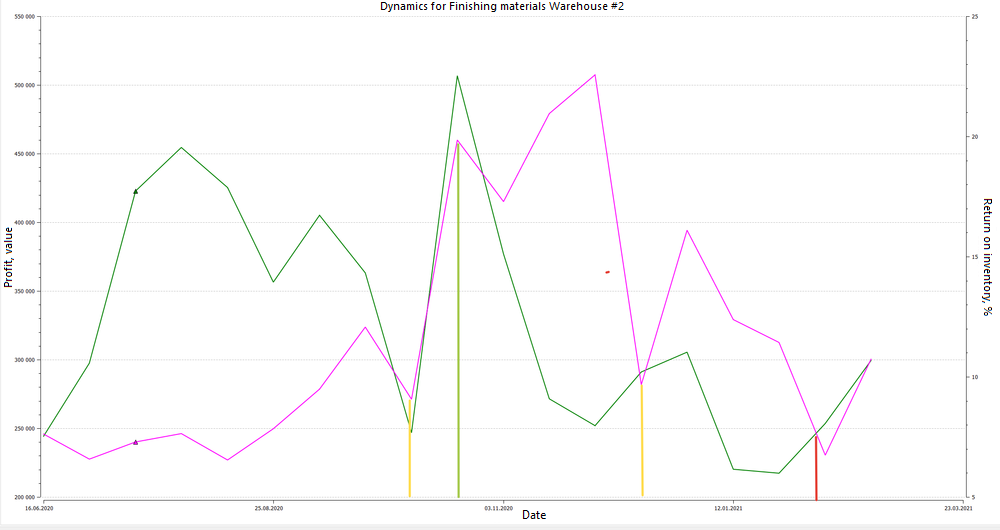
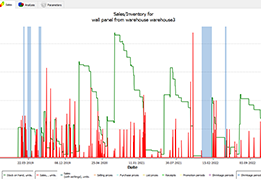
Evaluating metrics over time. Dynamics graph for finishing materials, Warehouse 2. Return on inventory.
The maximum return was achieved in October 2020, and then it began to decline. Now let's compare these points with the turnover graph.
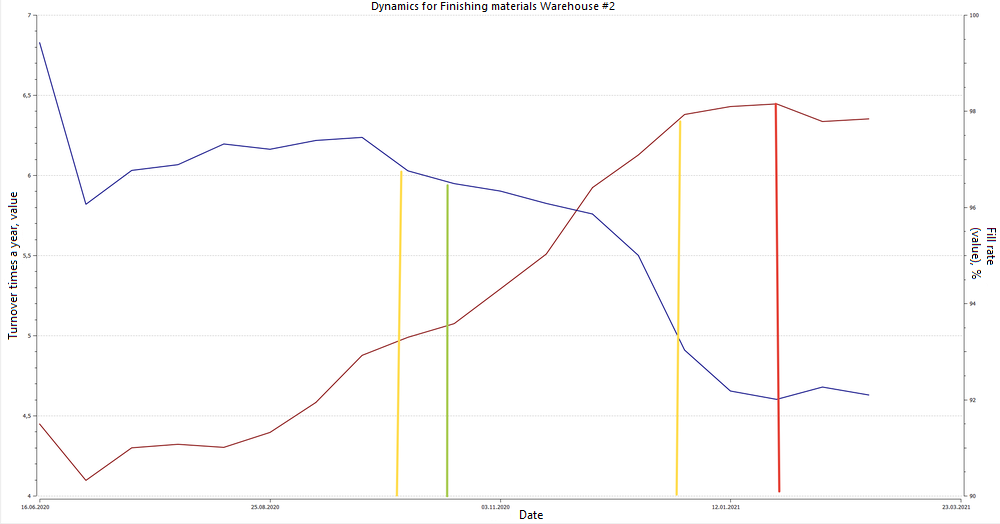
Evaluating metrics over time. Dynamics graph for finishing materials, Warehouse 2. Service level II, %.
It becomes clear that the worst profit and return were received at the end of the period when the service level dropped significantly and turnover increased. This means that deficits and lost profits became much more expensive for us. The best return was somewhere in the middle of the period when turnover started to increase and the service level slightly decreased. Yes, we experienced a decrease in service level, but at the same time, we observed growth in turnover and return. The money we earned from each ruble invested in inventory was maximized.
We can overlay one graph on another and understand where we did better and where we did worse. Such an analysis of the effectiveness of inventory management allows us to define the best strategy for ourselves - either to increase turnover while decreasing service level, or vice versa, to slightly increase the likelihood of shortages and turnover.
You can compare efficiency metrics with your past performance, look at them dynamically, and based on the results, conclude whether you have improved or worsened in managing your inventory. If there is a lag in any area, expand the graphs to specific goods and assess the situation from all sides. Why have you become worse at managing a particular position? Maybe some supplier is not delivering goods. Or perhaps there was a marketing purchase. They promised you a bonus for a large volume, you purchased the goods, but in the end, they don't sell, and you lose money on unsold items.
Comparison with Benchmarks
You can compare your metrics against industry standards, expert opinions, or your internal benchmarks. For example, you might decide that your turnover ratio should be 6 and your profitability should be 230%. These would then become your benchmarks.
The question is how to obtain these benchmarks. You can develop them internally within your company or enlist the help of experts. A good tool for this can be the calculated turnover rate proposed by Charles Bodenstab in his book "How many Inventory Turns Should I Get?"
Charles Bodenstab, owner of a logistics company, renowned consultant, author, and software developer for logistics management, analyzed data from a large number of companies and summarized the results of empirical research in the following formula:
Turnover Ratio = 12 / (f (OF + 0.2*L))
OF – an average order frequency in months (i.e., the time interval between placing orders with the supplier);
L – an average delivery period in months (i.e., the time between placing an order and receiving the goods);
f(1.5-2) – a coefficient that generalizes the impact of other factors affecting the theoretical number of turnovers:
- the range of products in storage, i.e., the need to store slow-moving stocks (usually for marketing purposes);
- purchasing more than necessary to receive volume discounts;
- minimum purchase batch requirements from the supplier;
- unreliable suppliers;
- stocking up for product promotions, etc.
The turnover ratio, according to the author, depends on how often we place orders, what our delivery times are, minimum batches, and so on. We divide 12 by this formula to get the standard turnover ratio and compare it with ourselves. Or we use the standard determined by the expert specifically for your company.
The difficulty is that any expert opinion can be erroneous and not correspond to the current situation in your industry, and these standards need to be constantly reviewed. The same formula by Charles Bodenstab cannot be 100% true. Yes, he may have analyzed the activities of many companies. And whether this formula is relevant today is also a big question.
Comparison with market standards is perhaps the most workable option. If we performed better than the industry, that's not bad. If we are at the level of the industry, that's not very good because we want to move forward in the industry. And to stay in place, we must run twice as fast. If we perform worse than the industry, we need to think about whether we are doing everything right in inventory management.
The image shows an example of key performance indicators calculated for three industries.
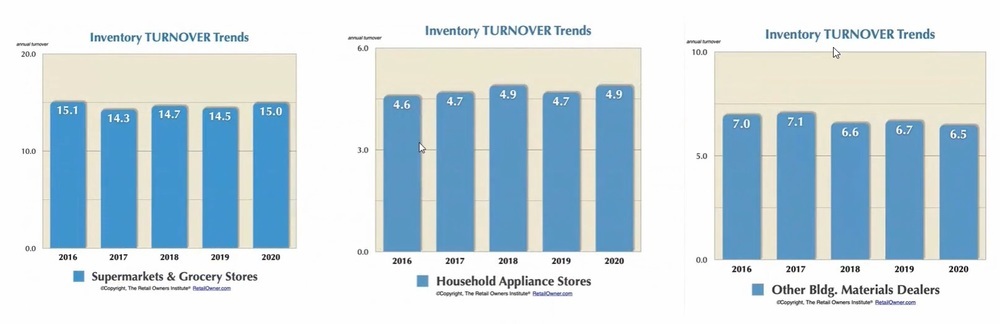
- Supermarkets have a turnover ratio of about 15.
- Home appliances have a turnover ratio of 4.6 to 4.9.
- Building materials range from 6.5 to 7.
Therefore, if you know any benchmark indicators in your industry, and closely communicate with colleagues or competitors, you will most likely be able to determine the efficiency standards for your field and compare those values with your own.
Which method of comparing indicators to use for a more accurate analysis of inventory management efficiency is up to you. In our opinion, it is necessary to compare the obtained indicators both with oneself and with accepted industry norms.