In our previous article, we delved into two essential performance indicators for inventory management: turnover rate and deficit level. Today, we'll discuss missed demand, lost profits, inventory profitability, and second-degree service level.
Missed Demand
Increasing the efficiency of inventory management cannot solely be based on turnover. Deficits need to be considered as well, given they result in missed demand and consequently, lost profits.
Missed Demand = Forecasted demand during deficit - Actual sales during deficit
This represents what we could have sold based on predictive models, subtracting what was sold during the deficit period. If you don't have specific software, the forecast can be based on average sales. However, if you do use software, it calculates the missed demand and lost profit automatically.
Lost Profit
Lost Profit = Missed Demand * (Weighted Average Selling Price - Weighted Average Cost of Service)
Let's delve deeper into the indicators that characterize inventory management efficiency. If two products have the same lost profit annually, does it mean we manage them with equal efficiency?
Certainly not. One product might generate significant profit and have a high turnover, while the other generates less profit with a low turnover. For instance, if the lost profit for both products is USD 100 annually, but the first product yielded a profit of USD 10000 and the second only USD 1000, it's evident that we manage the first product more efficiently. The proportion of lost profit is much less for the first product than for the second. If the lost profit is identical for two products, it doesn't provide much insight. To understand which product is managed better, other indicators must be considered.
Can we claim that the absence of lost profit equates to effective inventory management? No. Excessive stock might satisfy the demand. Keeping 100 units of a product every day with a weekly demand of only 10 units doesn't guarantee efficient inventory management. While there's no missed demand and the service level is at 100%, there's an excess in inventory.
To reiterate: Evaluating the efficiency of inventory management requires a holistic approach – analyzing inventory profitability, turnover, etc.
Knowing the missed demand and lost profit in the past allows us to calculate the service level. It shows us the demand we met in the previous period.
Type II Service Level (Fill Rate)
Fill rate refers to the percentage of demand that we can guarantee to cover using the existing stock in the warehouse during its replenishment period. Let's say, the total demand for a product is 100 units per month, but there are only 70 units in stock, all of which were sold. Thus, the Type II Service Level is 70%. For a detailed understanding of the service level, refer to the article "What is the Service Level and Why Is It Important?"
Fill rate in monetary terms, % = (total sales amount / (total sales amount + missed demand amount)) * 100%
We recommend calculating this indicator in monetary terms. If we consider units, the analysis may be inaccurate. Nails and tractors are sold at different frequencies; comparing their sales in units is impractical. When aggregating products with unequal sales dimensions, money is the most objective measure for assessment.
Can a 100% service level guarantee effective inventory management? No, it isn't a guarantee. Planning for a 100% service level is impractical. In this case, for rarely demanded products, there will be enormous safety stocks to accommodate demand fluctuations.
We can plan the service level for the future and later compare the results: what was planned versus what was achieved. We'll delve deeper into how to do this in subsequent lessons.
Now, let's see how to calculate inventory management efficiency with an example. The image provided showcases metrics for a retail point.
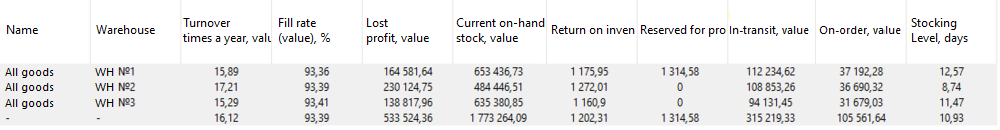
We have Warehouses No.1, No.2, and No.3. Turnover for each retail point, service level, number of deficit days, missed profit obtained, and other metrics have been calculated. The analysis is based on each retail point and is broken down into categories. We can delve into the specifics of each product and assess its particular efficiency indicators.
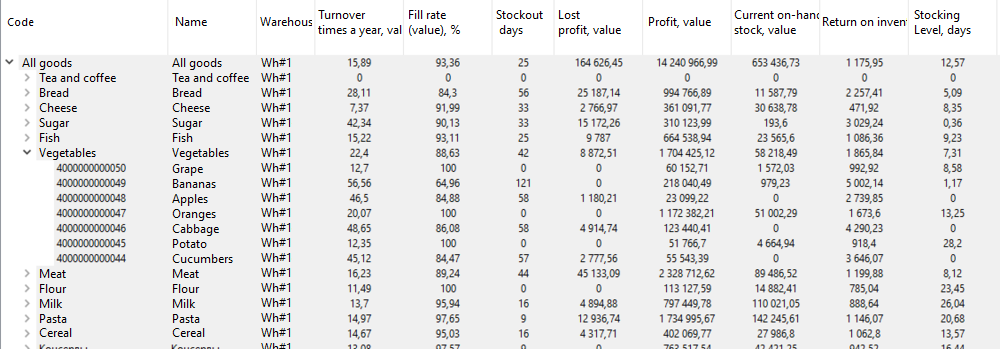
There are often scenarios where we wish to compare efficiency metrics for a single quarter across two years. Such comparative analysis helps understand your progress trajectory. Importantly, one should consider all metrics collectively – turnover, service level, missed profits, and others.
Let's practice. Which warehouse manages the insulation material stocks most effectively?
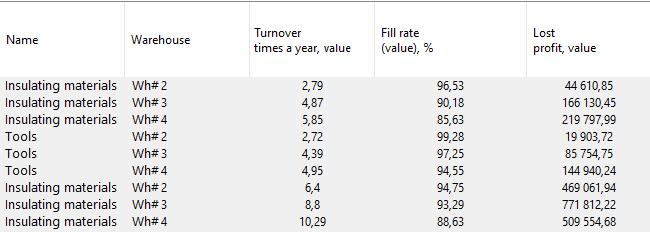
The image illustrates data for three warehouses, along with their efficiency metrics. Warehouse No.2 has the lowest turnover, but it also boasts the highest service level. This is a common situation: a higher service level often results in lower turnover. Having large safety stocks can lead to slower turnover. Moreover, this particular warehouse records the least missed profit.
Then, there's Warehouse No.3, which displays average metrics for turnover, service level, and missed profit. Warehouse No.4 has the highest turnover but records the most missed profit and the lowest service level among the three. Can we determine which warehouse manages its stocks best? It's hard to say. Each scenario will depend on what's preferable: accept lesser missed profits due to low turnover or more missed profits while ensuring higher turnover and a slightly lower service level. To get a complete picture, other metrics are needed, especially profit and stock profitability. We need to assess how much we earned in the past period and the profitability achieved.
Stock Profitability
Stock profitability indicates how much we earn from each invested dollar (or ruble) in stocks. Profitability of 200% means you invested a dollar and received two, while 150% implies an investment of one dollar yielded one and a half.
Profit = Daily sales * selling price - (daily sales * MAX (purchase price, accounting price))
Stock Profitability Formula:
Stock Profitability = Profit / Average monetary balance * 100%
Continuing with the analysis, let's review the table below. What do we observe?
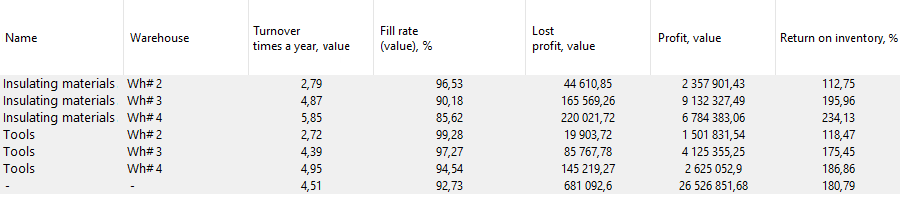
Warehouse No.2 is underperforming with low profit and stock profitability. Warehouse No.4 should be closely analyzed since it has the highest calculated profitability. However, we recorded more profit from Warehouse No.3. The missed profit portion for this warehouse is much lower than what the missed profit would be from Warehouse No.4's profit. Perhaps, Warehouse No.3 is more advantageous, even with its lower profitability.
For missed profits, we can compare different product groups, but for turnover, only similar products and points should be compared. Remember, to get a comprehensive view, all metrics must be considered together. Enhancing inventory management efficiency requires a well-thought-out holistic approach. Yes, turnover is crucial, but it's essential to evaluate missed profits, service levels, stock profitability analysis, and earned profits. It's vital to be aware of your past performance metrics, whether they've improved or declined, and to compare them with set standards. Only then can you make an informed decision on how effectively you're managing your inventory?