How can we discern that we are effectively managing our inventory? What insights do turnover rate, coverage ratio, deficit, missed profit, or inventory profitability offer? In this article, we'll discuss which key inventory management indicators require special attention to optimize business operations and increase profits.
Let's delve into why evaluating inventory management effectiveness is necessary. What issues can we address?
- Evaluating dynamics and analyzing inventory management effectiveness: It's crucial to track the dynamics: and understand the current state compared to past periods - whether it's better, worse, or at the same level.
- Comparing retail points: This allows for identifying the best and worst among them and, based on this, deciding which ones need to be closed or reformatted.
- Identifying problematic product groups: On one hand, these are the groups with non-liquid and excessive inventory. On the other hand, those that consistently exhibit missed profit and deficits. Knowing these groups helps adjust their procurement processes, avoiding surplus inventory and deficits.
- Tracking objectives: Analyzing inventory management effectiveness over a specified period helps us understand whether we've achieved the set goals or not.
Inventory Turnover
Often we hear from clients: we want to increase inventory turnover and monitor it. This indicator shows how many times over the analyzed period the enterprise utilized the average inventory balance. The standard depends on the industry. The higher the turnover, the higher the revenue is likely to be, based on the average inventory at hand.
Let's highlight two primary indicators related to turnover.
1. Inventory Turnover Ratio.
This metric shows how many times the average inventory is turned over in a year. It is measured either in times per year or turnover days. There are several formulas:
Inventory Turnover Ratio = Average sales / Average stock * 365 (or another calculation period)
If you multiply average sales by 365 (the considered period for inventory turnover), you either get our revenue or the cost of goods sold (COGS). This depends on the prices we want to use for calculating turnover. However, a different formula is more commonly encountered in practice:
Inventory Turnover Ratio = Cost of Goods Sold / Average stock
2. Reverse Indicator
Knowing the coefficient and how many times our stock turns over in a year, we can find the turnover ratio in days (this metric is called "days coverage"). To do this, divide the number obtained by 365. The formula for inventory turnover in days is:
Turnover in Days = 365 / Coefficient
The higher the turnover ratio, the better. If we express turnover in days, the situation is the opposite: the shorter the period of goods turnover, the better.
Of course, in different fields of activity (for example, food products and spare parts), there will be distinct turnover indicators. It's necessary to adjust for the fact that within the assortment, there may be items with different turnover rates. So, if hypothetically the turnover of juice is higher than that of canned goods, it doesn't mean that canned goods should be purchased less. These items simply have different turnover periods.
Let’s take a look at how this looks using an example. Here are three databases for a small number of products from enterprises of different sectors.
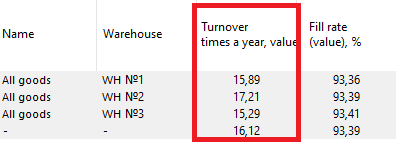
In the image below – a database of food products. The average inventory turnover per store is 15-20 times a year.
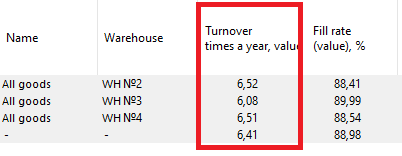
This is what the database of auto parts looks like. The average inventory turnover is about 6 times a year. It can range from 5 to 7 times a year depending on the field of activity and direction.
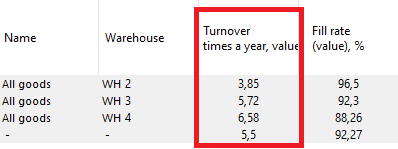
On the next slide, the turnover of building materials is presented. In our practice, this indicator ranges from 3 to 7 times a year. It also depends on the season, product group, and field of activity.
Is High Inventory Turnover Always Good?
Let’s consider an example.
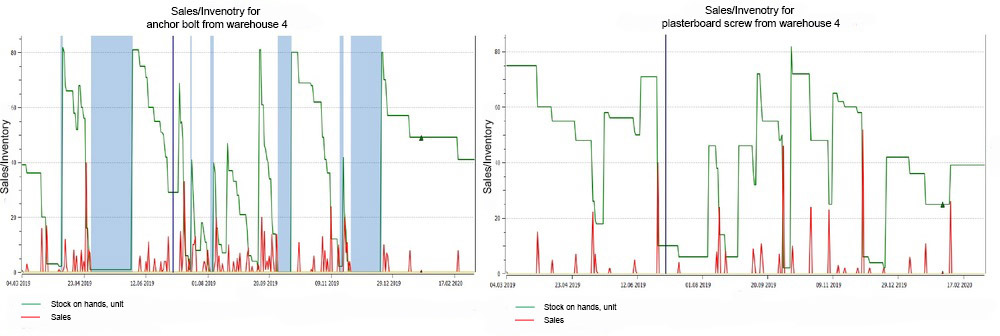
Here you have two sales graphs for different items. Green indicates inventory levels, and red indicates sales. We see that these two items are purchased in roughly equal amounts (from 40 to 80 pieces) and the inventory levels for them are similar. However, the sales for the first item are significantly higher. This might be related to the nature of the item.
If we calculate the turnover coefficient using the formulas, we get a turnover of 19 times a year for the first item, and 9 for the second. Can we say that we manage item #1 better?
The blue highlighted areas represent periods of deficit when the green inventory graph falls to zero. We see that for the first item, there were three periods of deficit over the last year, implying we missed out on profits despite the high turnover of the item, which is higher than that of the similar group item. It's important to understand that high turnover is also achieved through deficits. Therefore, we can't say we managed this item well. More accurately, these data points are not sufficient for a full understanding of the situation.
Deficit occurs when:
- both inventory and sales are at zero;
- on a certain day sales are zero and inventory is less than the average daily sales;
- end-of-day inventory is at zero and sales are below average for the considered day.
If the end-of-day inventory for an item is 0, it's not always a deficit. It's necessary to remember to account for write-offs. This is most common with perishable products. Suppose the end-of-day inventory for such a product is zero. But if we wrote it off, it's not a deficit. Perishable items require an individual approach.
Inventory Deficit Level
Is a deficit ever good? A deficit in a particular item can affect inventory management. Let’s consider an example with items from group z, which have erratic sales and unstable demand. If we maintain a higher service level for them, conversely, we'll lose money because we'll build up a stock of non-liquid assets.
If we planned a 98% service level for a group of items but achieved 100%, that's good. Achieving 99% is also good. This 1% deficit will cost us less than possibly covering it in the past would have. Therefore, a good deficit is one that fits within the planned service level.
What percentage of the deficit can we trust?
If an item is constantly in deficit, it’s likely a made-to-order item. It makes sense: we continually bring in the item and sell it immediately. If we calculate lost profits and other factors for such an item, and aggregate this data for the entire retail point, we will distort our statistics and, accordingly, inflate all other indicators.
It’s essential to define for ourselves what percentage of deficit we can trust. In practice, this usually ranges from 30% to 50% depending on the item. Accordingly, it's not advisable to calculate deficit and lost profits for items that don’t fall within this percentage.
In the following article, we'll discuss missed demand, lost profits, inventory profitability, and second-degree service level.