The term "service level" is commonly used in logistics and inventory management. Let's delve into what it means.
Firstly, it's important to know that when planning inventory, companies usually distinguish between two types of service levels: Type I and Type II.
Type I service level refers to the probability of completely avoiding a stockout during a supply cycle. For example, if you have 100 scheduled deliveries for the coming year, a 95% service level would mean that only in 5 out of those 100 instances could there be a shortage of goods in the warehouse between deliveries.
Companies usually set their Type I service level targets. Depending on demand and delivery schedules, the volume of goods needed from suppliers is calculated. For instance, if a company aims for a 95% Type I service level for Product A with weekly deliveries, it may require 100 units of the product. If the same product requires a 99% service level, the volume of the weekly deliveries would increase.
It's crucial to understand that the Type I service level does not answer the question, "How much demand will the company miss during stockouts?" It merely defines the probability of completely avoiding a stockout during a supply cycle.
Type II service level, also known as the fill rate, addresses questions like, "How much demand will we fulfill?" or "Exactly how much of a shortage will occur?"
Fill rate refers to the portion of demand that we can reliably cover using the available stock during its replenishment period. For example, if the total demand for a product was 100 units per month, but only 70 units were available in the warehouse and were sold, then the Type II service level would be 70%.
Understanding both types of service levels is crucial for effective inventory management and satisfying customer needs.
How to Calculate Fill Rate
Usually, the demand that has been fulfilled is known to us, and the unmet demand can be forecasted. Calculating the number of goods that we could have sold during a period is a function of the company's forecasting system or methodology. For instance, one of the simplest methods to estimate demand is to look at the average daily sales. If there were no goods in the warehouse for 5 days and the average daily sales equal 3 units, the unmet demand would be 15 units.
Fill Rate = (Fulfilled Demand / (Fulfilled Demand + Unmet Demand)) * 100%
Using the service level metric allows for individualized management of various products and product categories. Firstly, it helps evaluate past inventory management effectiveness—understanding how well you've met demand and how much money was lost due to shortages. Secondly, it helps influence future demand by setting different service levels for different product categories. This opens the door for more effective inventory management and planned revenue.
Comparing Type I and Type II Service Levels
The graph below illustrates how much additional inventory a company needs to maintain if it wants to improve its service level. Safety stocks are calculated in terms of the standard deviation of demand.
Looking at the red curve (Type I Service Level), you can see that its increase leads to a significant rise in safety stock. It aims to ensure that there is no stockout of any product between deliveries. Thus, even a 1% increase in Type I Service Level can result in substantial increases in safety stock levels.
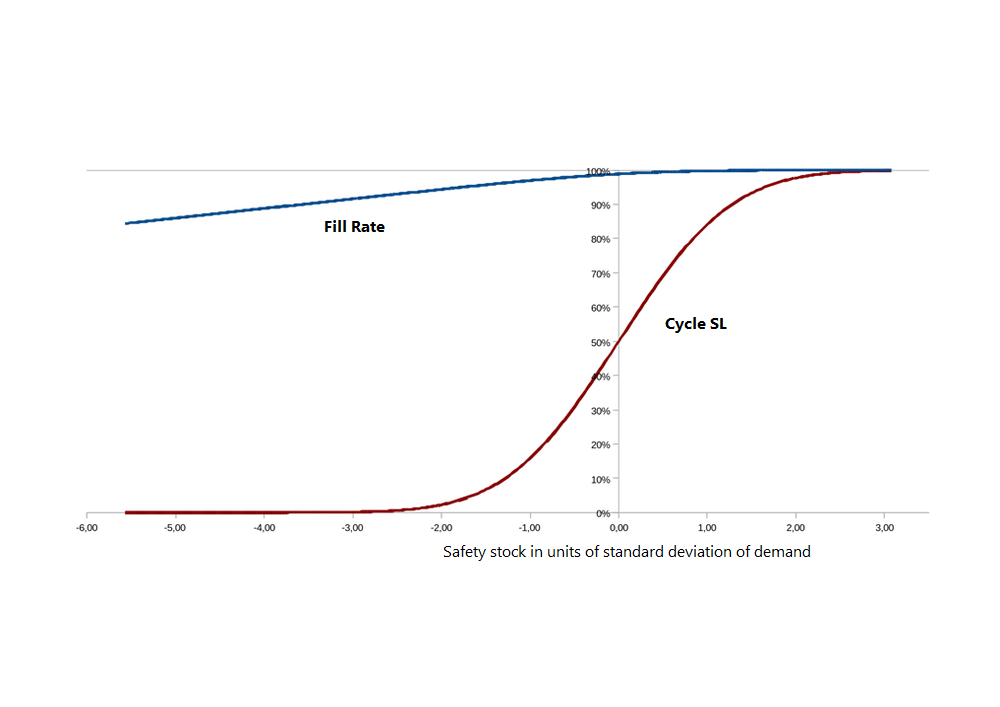
The Type II Service Level curve (blue) has a gentler slope. Therefore, its changes do not impact the safety stock as dramatically. For example, at a 90% service level, there may be virtually no need for safety stock, while increasing it to 95% would result in only a modest increase. Type II Service Level indicates what percentage of demand will be fulfilled.
When using Type I and Type II Service Levels for inventory management, it's crucial to distinguish between the two and understand the specific purposes for which they are calculated.
Service Level Calculation Example in Forecast NOW!
In Forecast NOW!, you can calculate the actual service level for a past period and also set it as a target metric for inventory planning and order formation.
Service Level Planning in Forecast NOW!
In Forecast NOW!, you can establish a target service level and understand how various inventory sizes will ensure different service levels. Before calculating the service levels, the software simulates demand and the likelihood of its occurrence during the order period. Here's an example of one-day demand calculations:
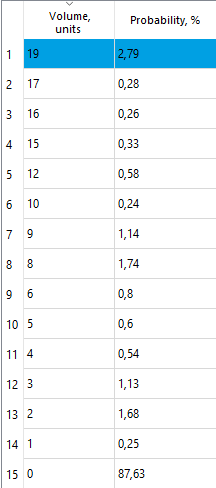
From the table, you can see that there's an 87.63% chance for zero demand, a 0.25% chance for demand of one unit, and so on.
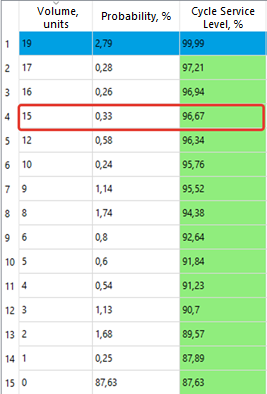
Type I Service Level Calculation
Let's say we plan to keep 15 units of a product and want to determine the Type I service level we can achieve. To do this, we need to find out the probability of facing a stockout. A stockout will occur if the demand is 16 units (0.26% probability), 17 units (0.28% probability), or 19 units (2.79% probability). Thus, the Type I service level with an inventory of 15 units would be 96.67% (a stockout may happen in 3.33% of cases, which is the sum of 2.79%, 0.28%, and 0.26%).
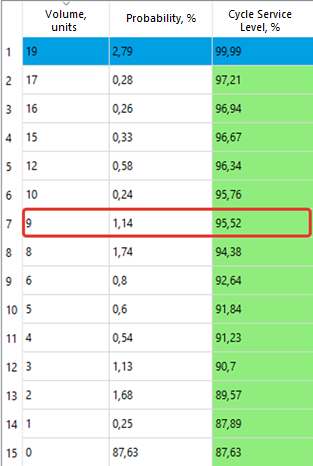
We can also solve the inverse problem—determine how much inventory is needed to ensure a specific Type I service level (for example, 95%). With zero inventory, we'd face a stockout in 87.63% of cases. With one unit, we'd cover an 87.89% service level (87.63% for zero demand + 0.25% for one unit demand). With 5 units in stock, we'd cover 91.84% of cases (summing up the probabilities for the demand of 0, 1, 2, 3, 4, and 5 units).
Thus, for each possible inventory size, we can calculate the guaranteed Type I service level. To ensure a 95% service level, we need to find an inventory size that closely approaches but exceeds this target value. For the example considered, that would be 9 units.
Forecast NOW! automates all these calculations. Additionally, the software can tell you how much more inventory you need to maintain to achieve a higher service level.
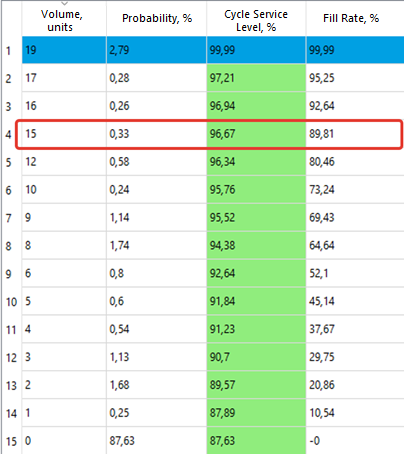
Calculating Fill Rate
In our calculations, we aim to understand the percentage of demand that will not be met for different inventory sizes. To do this, we first need to calculate the expected demand. Each possible level of demand should be multiplied by its likelihood of occurrence and then summed up.
For our example, the expected demand equals 192.79% + 170.28% + ... + 1*0.25% = 1.17384. After that, for each inventory level, we need to calculate the likely stockout. For instance, if we have 15 units in stock, the likely stockout equals (19-15)*2.79% (4 units will not be sold with the demand of 19 units likelihood) + (17-15)*0.28% + (16-15)0.26% = 0.1196. Therefore, we won't cover 0.1196/1.17384100% = 10.19% of expected demand. And the inventory of 15 units guarantees a 100% - 10.19% = 89.81% Type II service level.
The software automatically performs all the required calculations and generates orders to ensure the target service level, be it Type I or Type II.
Calculating Actual Service Level
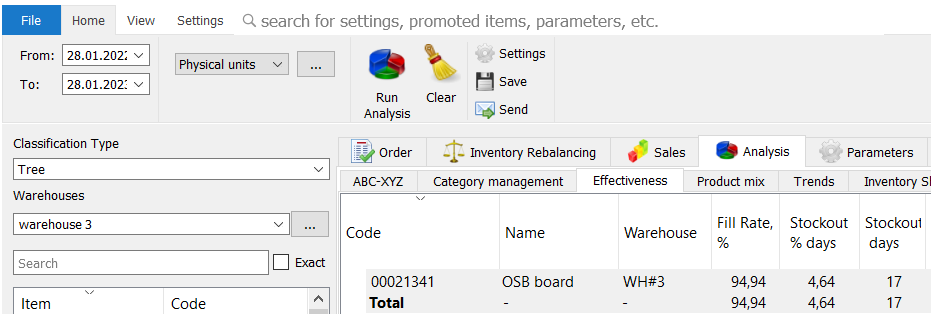
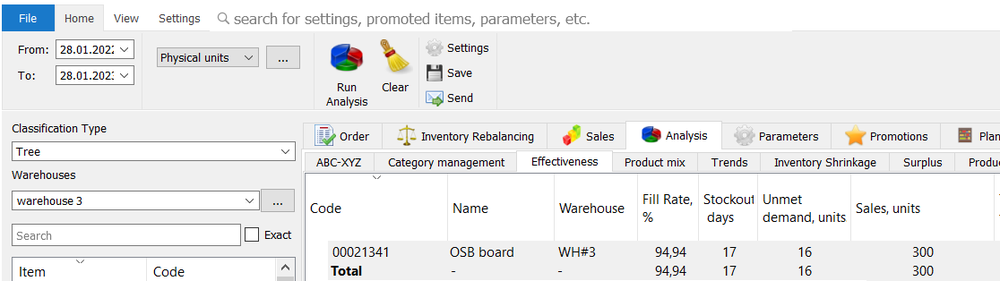
Forecast NOW! calculates the service level that was achieved in the past period (for individual products, product groups, individual stores, or the entire network). The Fill Rate is usually assessed, which is the percentage of demand met. In the example illustrated, annual sales were 300 units, and the missed demand over 17 days of stockouts (calculated by the software) was 16 units. The actual Type II service level for the product was 300 / (300 + 16) = 94.94%.
For product groups, the service level is calculated as the average of the service levels for each product in the group. Products with a zero service level are not included in the calculation.
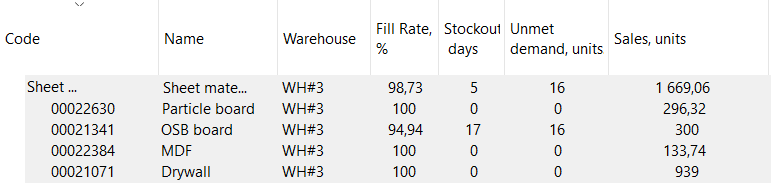
The service level for the "sheet material" group equals (100% + 94.94% + 100% + 100%)/4 = 98.73%. The actual Type I service level can be assessed as 100% - the percentage of stockout days/17 days of stockouts, which accounts for 4.64% of the analysis year—the actual Type I service level equals 100% - 4.64% = 95.36%.