Service level is a crucial indicator in inventory management. It enables an individual approach to the management of product stocks and product categories. Service level allows us to evaluate past inventory management KPIs and influence future demand. In this article, we will cover the three main methods used to set service level: the expert method, ABC analysis, and loss minimization. Let us look at the advantages and disadvantages of each of them.
What is service level?
For starters, the two types of service level most often used in inventory planning are cycle service level and fill rate.
Cycle service level means the probability of not having any stockouts during an ordering cycle. For instance, you expect 100 deliveries in the coming year. A 95% service level would mean that only in 5 cases out of 100 there may be a shortage of product in the warehouse between deliveries.
Cycle service level is a value usually set by the company itself. Depending on demand and lead time, the quantity of products to be delivered by the supplier is calculated. Thus, for example, if a company aims to hit at cycle service level of 95% for product A within a lead time of 1 week, it may need 100 units. If a 99% service level is required for the same inventory item, you'll need to order more units in weekly deliveries.
It is important to understand that Cycle Service Level is not a solution to the “How much of demand will not be met due to a stockout” question. It only determines the probability of not having any stock-outs during a replenishment cycle.
At the same time, Fill Rate answers a different set of questions: “How much demand will we satisfy?” or “How much of a stockout could occur?"
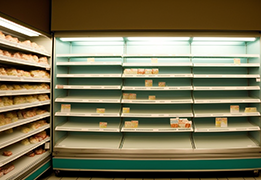
Fill rate is the amount of demand that we can meet using inventory on hand during a replenishment cycle. Let's say the total demand for a given item is 100 pieces per month, but we had only 70 units in stock, all of which were ultimately sold. The resulting fill rate is 70%.
Ways to Determine Service Level
Expert Method
The essence of the method is that the service level is set by an expert. We can perform it ourselves for some units. For instance, for anchor products that must be available. Additionally, service level can be established based on supplier request or the opinion of analysts. Obviously, this method won't work for a wide range of products and a network with many points of sale. The expert method is used either only for individual, high-demand products or where there are specific agreements with a supplier.
Estimating Service Level Using ABC Analysis
In most cases, ABC analysis is applied when product stocks are to be classified in terms of a chosen parameter. [The article is currently available in Russian.] This method allows you to group products from AA to CC using specific criteria. ABC inventory analysis will help uncover which products are the best-selling ones, which we should focus on, what product groups we have, when to set order cycles, etc.
ABC analysis can also be used to set the service level for a product group. Let's consider the following example. We've segments all products into several groups: from AA to CC. Criteria are specific to each group, such as frequency of sales, profit margin, and so on. After creating groups of products using ABC analysis, we can establish the service level for each group.
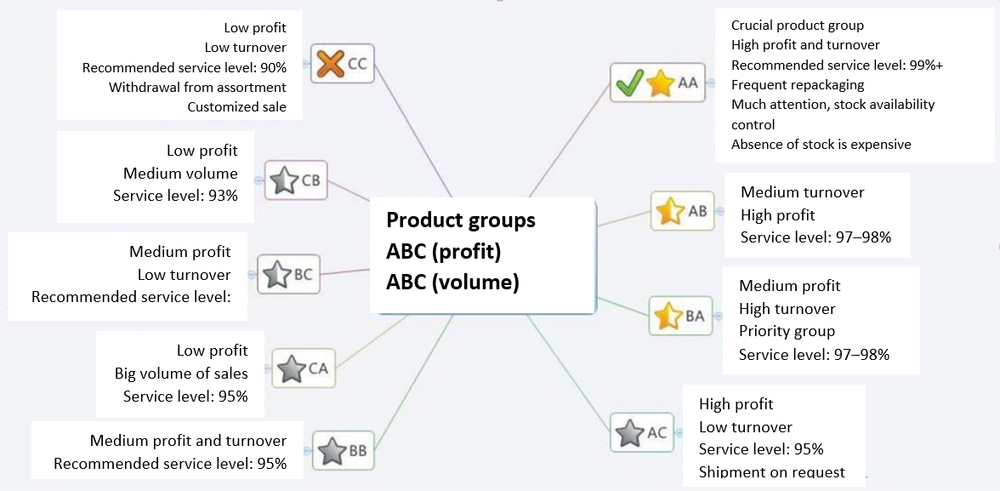 The AA group is the most critical. It shows the highest profit and turnover. If we run out of stock of AA group products, we will lose the most profit. That is why the highest service level will be set for this group, i.e. 99%. 99%.
AB group is fast-moving products that account for a smaller percentage of our profits. So we will look for a service level of around 97–98%. And so on until group CC, where the level of service is quite low: 85–90%. These products are rarely sold and are not profitable. Any stockout of these items will not have a significant impact.
Thus, we have categorized our products into ABC analysis groups and assigned service levels to each. After that, we can manage them using classical methods or with probability tables.
There can be many different ways to classify stock into groups. Our customers have used both three-factor ABC analysis, four-factor analysis, and even added FMR analysis or XYZ analysis. Various levels of rankings can be used for the categories; the main thing is to keep everything clear. In its simplest form, just as we have shown, we classify items into 9 categories. You can use even more groups if you like. However you go, the basic idea is the same: we divide the products into groups according to priority and then apply our own service level for each.
Advantages of ABC Inventory Analysis for Setting Service Level
- This method allows us to quickly begin assigning service levels. ABC analysis is fairly simple; it does not require any complex calculations.
- We can immediately manage our inventory in a differentiated manner: that is, we assign our own service level to each product group.
- This analysis is not strict in terms of the input data. For instance, if we don't have enough data for a certain period, we can still perform an ABC analysis and categorized products into groups. Purity of information is not required, either. It is much more important to make adjustments for stockouts and promotions.
Things to remember when using ABC Analysis to comput service level
- Service level in this case is still selected by an expert method. We ourselves decide how to form the AA, AB, and CC groups. However, we can't be certain how well we've chosen our rankings. Of course, there are proven methods and procedures, yet they may not work in each specific case for a specific item of inventory. We still run the risk of picking the wrong service level for a particular group of stock items.
- Products with a similar ranking can fall into different groups and receive different service level. Products with very close values can fall into different groups. One product that ranks higher on a certain value may be assigned to group A group, while another with a slightly lower priority value (e.g. profit) falls into group B. The products are very similar, but our approach to them will be different. profit) falls into group B. The products are very similar, but our approach to them will be different. For group B products, we assign a lower service level. We assume a greater probability of a stockout. Naturally, we run into a stockout of this item and lose sales. Yet this item could have been placed in group A and be turning a profit.
- Which product lines/warehouses to analyze. Consider a situation we encounter quite often: customers want to take into account the service level for individual suppliers, and then use ABC inventory analysis to set the service level to products. That is where things get tricky. You have good suppliers, and you have bad suppliers. Say, for example, a good supplier's products are in group C or B, and end up with a lower service level. And our bad supplier's products end up in group A, but are actually inferior to the good supplier's items in group B. They are less profitable and sold less often. Consequently, we have overestimated the service level for those units. And our inventory management is off the mark. This method depends on the way we perform the analysis, group the data, warehouses, etc.
- Before performing ABC analysis, don't forget to adjust for stockouts, promotions, and so on. When conducting the ABC analysis, we recommend excluding new products and adjusting for stockouts and promotional campaigns.
- This method does not always answer the question of economic efficiency. For example, how necessary is it for us in group AA to maintain a 99% service level? Therefore, methods have been created to set service level based on economic justification
Loss Minimization
Every company is out there to raise its bottom line. During the inventory management process, we face different expenses which could have been avoided or reduced. Let's see what factors can lead to losses when making a decision about keeping a particular item in stock.
- Lost sales. The fewer products we store, the higher the probability of lost sales.
- Carrying costs. The more products we store, the more expenses we have related to stock management.
- Spoilage risks. The more we store, the more money we can lose in spoilage. Typical for perishable products.
- Tied-up money. The more we invest in stocks, the more we lose at the rate of alternative investments. For example, we could use these funds to repay loans, purchase other more profitable products, or put money on deposit.
- Fine for short shipment (for distributors). The less we store, the higher the risks of fines.
We can lose money due to various factors. Our task is to understand how much money we will lose from various factors and try to minimize the total losses. A target service level can solve this problem based on selecting the right service level.
Target Service Level
When using probabilistic demand modeling methods, we know all the volumes of demand, the probabilities of their occurrence and can calculate how much money we lose from each volume of stocks. Thus, when we store a certain number of products, we will have certain lost sales, holding losses, spoilage risks, etc. If we add more product, we will reduce the probability of a stockout, but we will increase the risk of spoilage and the cost of product management. That is why to find a target service level, we can establish how much money we are going to lose due to the factors enumerated for each possible stock volume. This is the level at which we will have minimal total losses.
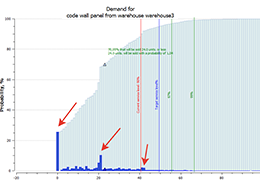
Let's take a look at how this works using an example in Forecast NOW! :
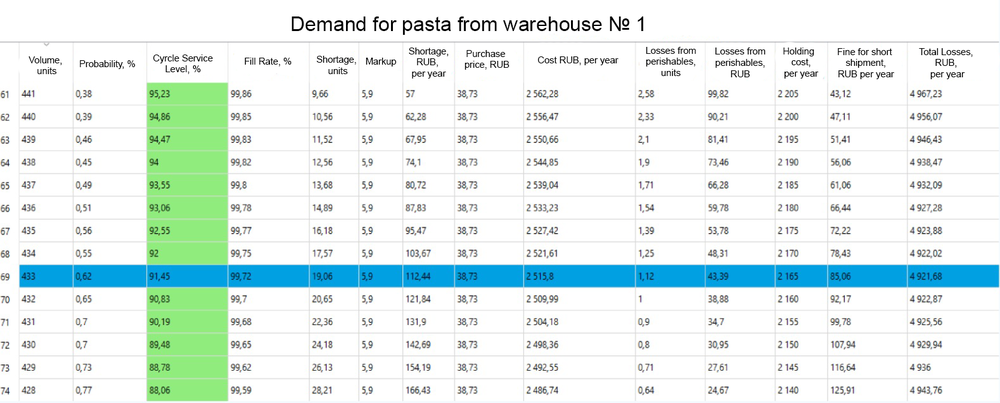 We can store from 428 to 441 items of stock. By storing 433 items, we will achieve a cycle service rate of 91%, and fill rate of 99%. With such a volume of stocks, we will lose 4,900 rubles annually. As shown in the table: if we begin to store more products, the losses will increase. If we store less, we will experience even greater losses.
This way we have arrived at the point where we've minimized our total losses from all factors. Here it is important to calculate the losses for the same period. In our program, we make annual calculations — how much we've lost from perishable products, stockouts, etc.
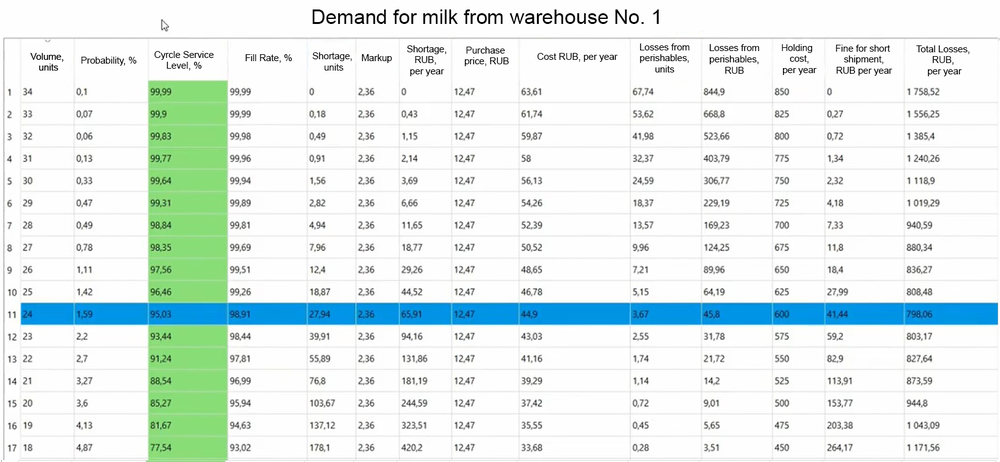
Let's have a look at another example, a perishable product. Different possible losses are set for it, and we keep it stored for two days.
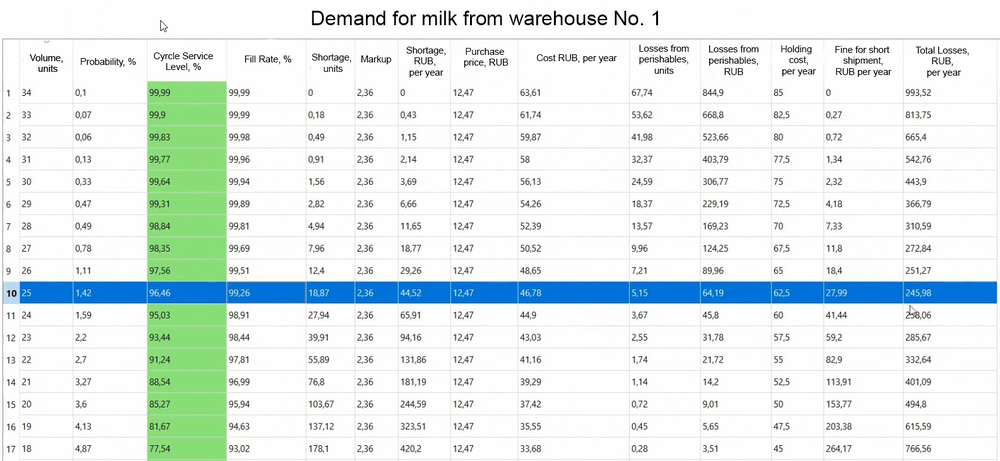
According to the first set of factors, we received the target stocking level for 2 days: 25 units. Cycle Service Level: 96%, and fill rate 99%. Total losses: 225 rubles per year. Let's see what happens if we change different input factors.
For example, we have milk with a shelf life of 7 days, and by default the supplier delivers products with a full shelf life of 100%. In reality, these guarantees cannot be met for every product. Imagine that our supplier guarantees that they will bring milk with a full shelf life of 70%. Thus, the shelf life decreases. The following thing happens to the stock:
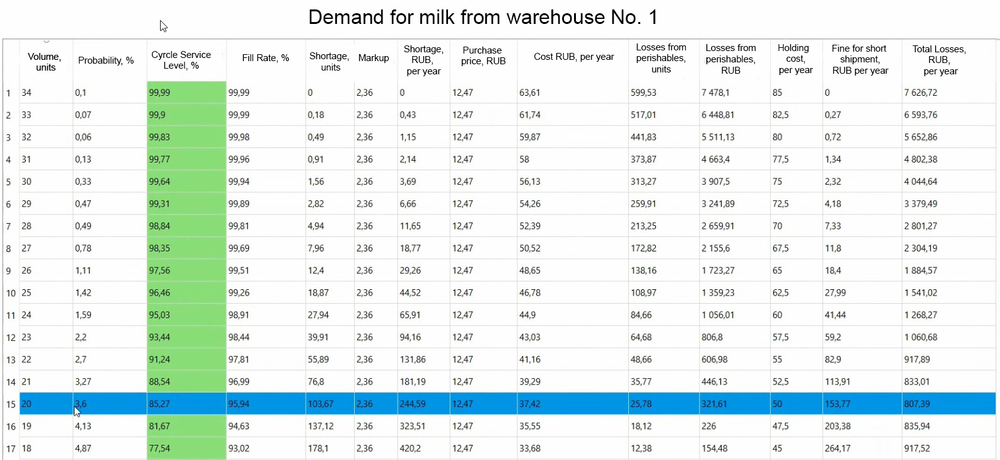 The optimal stocking level was 25 and has become 20. The shelf life has decreased which led to an increase in spoilage risks. For the same stocks, we may lose more money due to possible product spoilage. It is not profitable to store more products so the target stocking level has decreased as well.
Let's imagine that we have some fines for a short shipment. In the first example, they amounted to 10%. And now we have a very tough relationship with the vendor, and fines have increased to 70%. It is logical to assume that with larger fines, a shortfall becomes less profitable. Most likely, we will have to have more stock on hand than before.
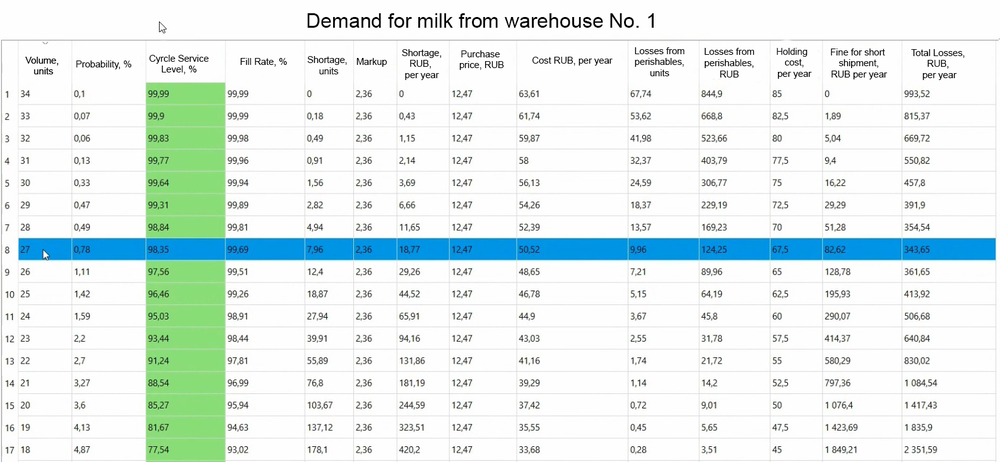 We make some calculations and see that the optimal stocking level has increased from 25 to 27 compared to the first example. In this case, it is now unprofitable for us to lose money from stockouts, because the supplier is fining us.
Let's assume that holding costs have increased. It used to cost 5 rubles for per unit weight and now the situation has changed radically and it costs us 50 rubles. Under these circumstances, it is more profitable to store less product.
 Thus, considering the total losses from various factors, we can constantly optimize the service level. However, we cannot forget that these external factors can managed: we can negotiate with the supplier for their guaranteed shelf life, reduce storage costs, optimize warehouses, warehouse staff, etc. As a result, all this will lead to the most profitable volume of stocks for us, and we will maintain our target service level.
Clearly, total losses such as these can't be calculated in Excel or any other sales accounting systems. Forecast NOW! allows you to work with various stock volumes in order to calculate a target service level for each individual order. When demand, guaranteed shelf life, or any other input data are changed, the program will re-calculate a target stocking level automatically.
Pros and Cons of Target Service Level
For ABC analysis we set the same service level for a group of products. For instance, there can be 2,500 in group AA, and the same service level applies to all. Target service level will differ depending on the product.
The complexity of the target service level method lies in its sensitivity to input data. For example, let's say we ran a sales promotin and the purchase price was higher than the sale price. It is clear that in cases like this that we will not be able to calculate the service level correctly. This method takes into account many factors, but all of them must be correctly entered. How can this problem be overcome? For example, in Forecast NOW! this is implemented in this way: if it is impossible to correctly calculate the target service level, we automatically switch to the regular service level.
We recommend that customers first set the service level for an ABC analysis and only then gradually transfer some product categories to the target level, and adjust over time going forward. Only in this way can we manager our inventory and service level smartly.