Results for Food Sales Company.
What-If scenario modeling helps answer "What if we had used Forecast NOW! during such-and-such period?"
Foodstuffs
At a Glance: The company specializes in wholesale and retail of food products
Modeling conditions:
362 products were selected to test along with company associates, relying on a customer-provided data base of 2 years, 1 month of sales history. Products were selected to cover the broadest range of potential sales situations:
- sharp weekly seasonality
- presence of other short-term seasonal fluctuations
- no short-term seasonality,
- identifiable trends,
- high/low sales goods
- high/low average daily sales,
- shrinkage,
- limited sales due to stockouts,
- short-term sales history (2-3 months),
- longer-term sales history (over six months)
Only items with at least six months sales history were selected.
8 weekly forecasts were generated for each product.
Thus, we simulated user experience with the software for 56 days. Supplier delivery schedules were selected to approximate actual delivery schedules.
Forecast accuracy was checked using the sMAPE for just the time-period of interest, giving us more confidence that our forecast is the best fit and reflects actual circumstances.
We used actual sales from the POS to calculate error and absolute percent deviation from the forecast.
Problems found inside the company:
Outside of perishables for which the store has a high actual stockout level, all inventories recommended by the system were much lower than actual levels. Some goods have avoidable low sales while others are overstocked by 5-6 times the needed level.
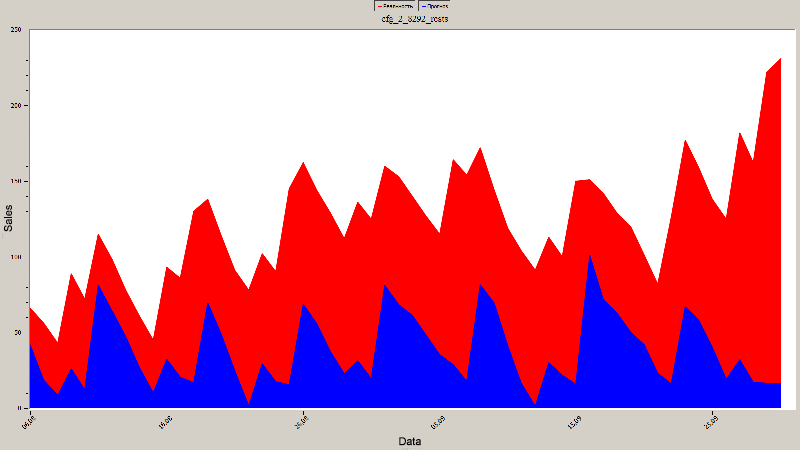
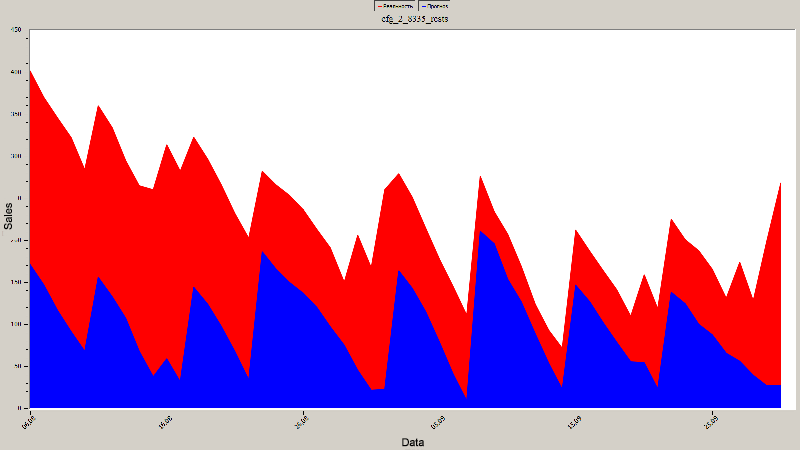
Examples of forecasting optimal inventory
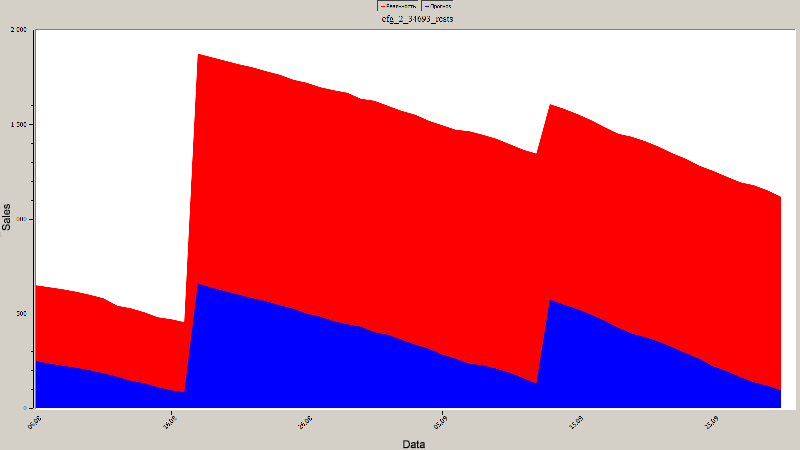
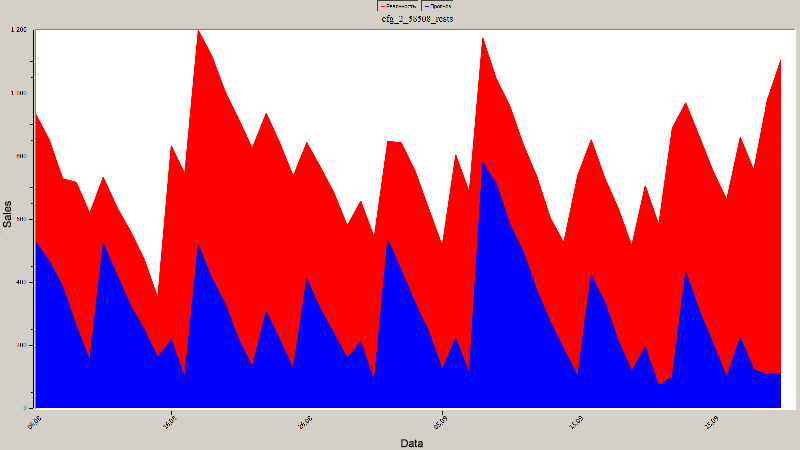
Moving from forecast to actual inventories, in all cases where actual inventory levels were not a factor of actual consumer demand - i.e., cases of shrinkage - the company achieved positive results in reducing tied-up capital and losses.
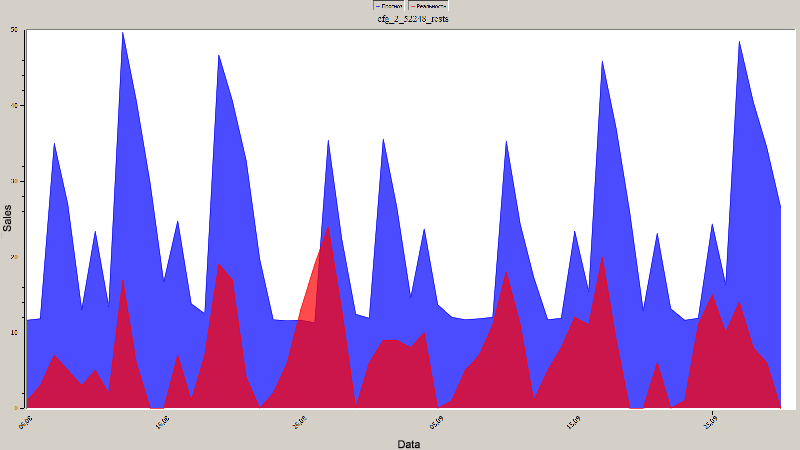
In other cases it was obvious that without safety stocks in store (example 6), stock-outs will occur from time to time. The charts show the safety stock and drawdown in dark blue, while actual inventory remaining and drawdown are shown in red.
In almost all cases (not including stock-outs which are standard for perishable goods), the stock level recommended by the system was lower than the actual inventory, while still completing meeting demand.
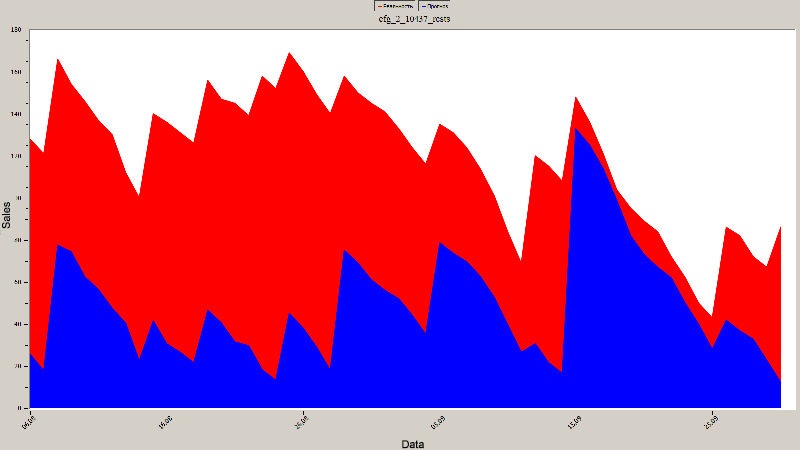
There are various possible scenarios with highly perishable goods, based on purchasing manager discretion, program behavior, or use of safety stock and assured inventories, or guaranteed no overstock. Example 6 depicts this scenario.
The red line shows frequent stockouts. The forecast is higher than actual inventory left in safety stock, meaning demand can be completely met.
Example 1
Example 2
Example 3
Example 4
Example 5
Example 6
Stock-outs can be prevented by using a safety stock level where necessary.
Summary of Results
The test case run for one of the network's stores showed that this solution was cost-effective for the company. The forecasting accuracy in this case helps select the optimal inventory level with a high degree of certainty. Ignoring perishable goods, for which the store has a high stock-out level, all inventor levels recommended by the system were much lower than actual levels.
For highly perishable products, the customer needs to decide which case is better for the store - avoiding stock-out situations or having overstock - and use this determination to set the safety stock level for perishables.
This way, Forecast NOW! helps customers free up significant working capital and use it most effectively. The test case shows that Forecast NOW! software should be used in the grocery network after bringing inventory levels to actual levels.
Summary:
The program will produce a savings of around 15% of the chain's turnover.